July 3, 2026
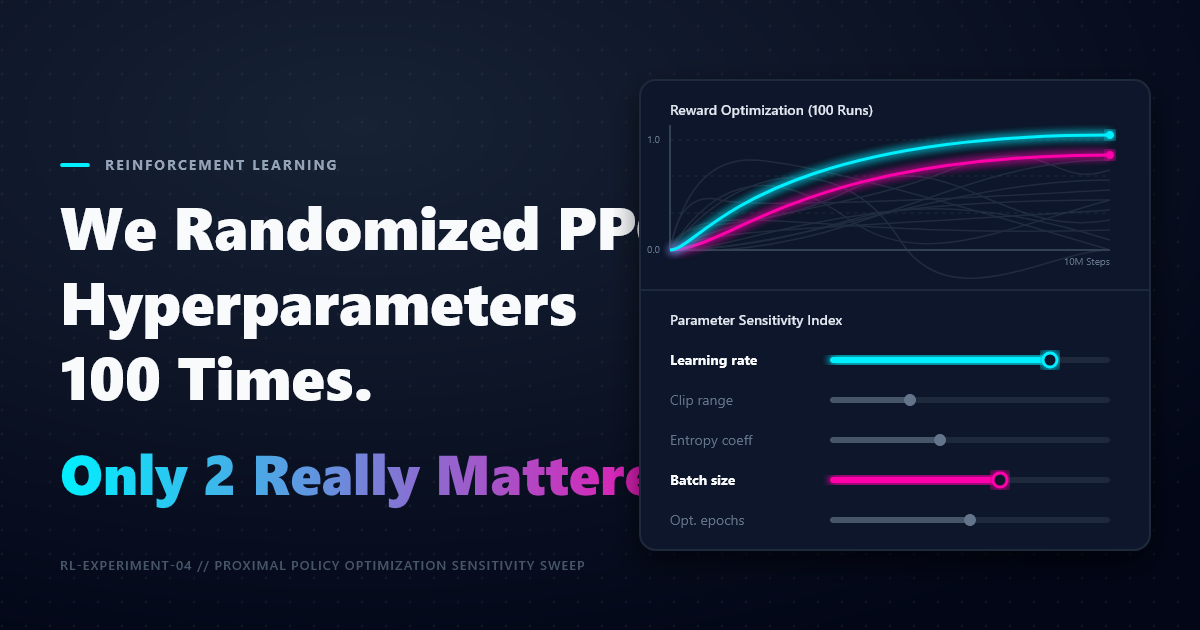
We Randomized PPO Hyperparameters 100 Times. Only 2 Really Mattered.
PPO has a reputation for being the “stable” reinforcement learning algorithm. That reputation is mostly deserved. Compared with older policy-gradient methods, PPO is easier to get running, easier to debug, and less likely to destroy a policy with one bad update.
But “stable” is not the same thing as “insensitive.”
In a previous experiment, How Sensitive Is PPO to Reward Shaping?, we held PPO’s hyperparameters fixed and changed only the reward function. The result was not subtle: small reward-design choices changed which agents learned, which collapsed, and which learned behavior that looked good in logs but failed the actual task.
That left an obvious follow-up question. If reward shaping can dominate the outcome, how much sensitivity is still hiding in PPO’s own hyperparameters?
If you have trained PPO for long enough, you have probably seen the pattern: one run learns quickly, another plateaus forever, a third learns and then collapses, and a fourth looks fine until evaluation exposes that it learned the wrong behavior. The usual response is to start tuning everything at once:
- Learning rate
- Clip range
- Entropy coefficient
- Batch size
- Number of optimization epochs
That raises a practical question: are all of these knobs equally important, or are we wasting time tuning parameters that barely move the outcome?
To find out, we randomized PPO hyperparameters and measured which settings actually predicted performance. The current draft includes a 25-run pilot sweep; the final version should repeat the same analysis on the full 100-run sweep.
The pilot version: PPO was not equally sensitive to every hyperparameter. In the 25-run pilot, epoch count and learning rate ranked highest, while clip range barely moved the result.
The Experiment
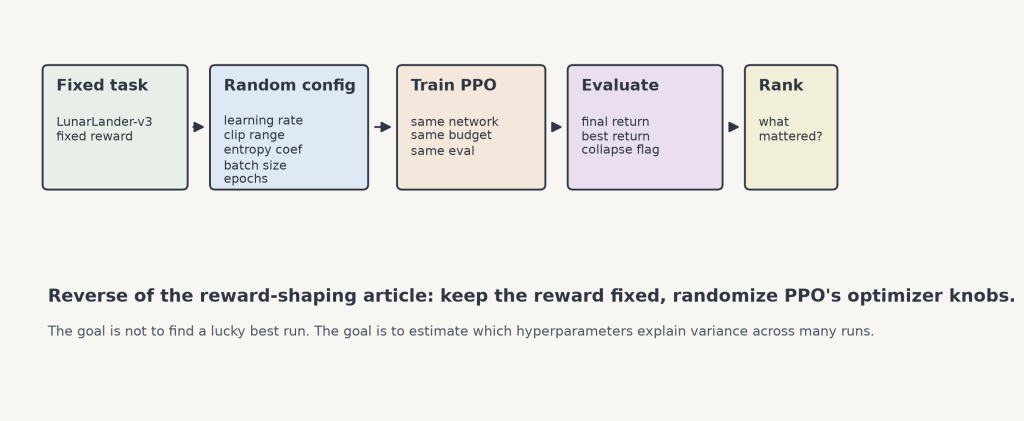
We used PPO on LunarLander-v3 and sampled random configurations. The pilot used 25 configurations at 100,000 timesteps each; the final sweep should use 100 configurations at the full training budget. Each run used the same environment, reward definition, network architecture, and evaluation protocol. Only the PPO hyperparameters changed.
That setup intentionally mirrors the reward-shaping article in reverse. There, the hyperparameters stayed fixed while the reward changed. Here, the reward stays fixed while the hyperparameters change. The point is to separate two sources of PPO sensitivity that are easy to blur together when debugging a failed run.
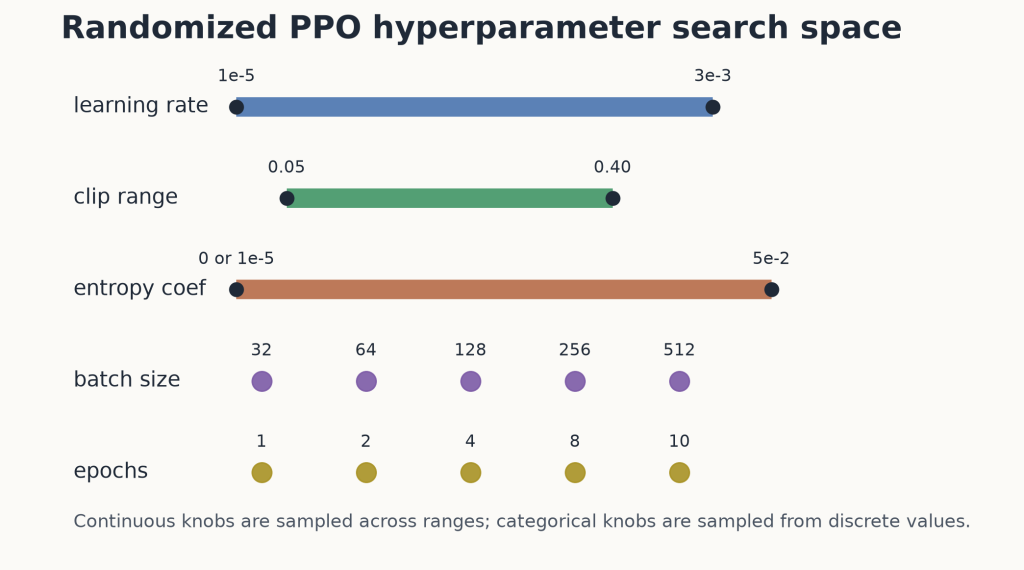
The sweep covered five common tuning knobs:
| Hyperparameter | Why people tune it | Sampled range |
|---|---|---|
| Learning rate | Controls update size and training stability | Log-uniform from 1e-5 to 3e-3 |
| Clip range | Limits how far the policy can move per update | Uniform from 0.05 to 0.40 |
| Entropy coefficient | Encourages exploration | 0 with 20% probability; otherwise log-uniform from 1e-5to 5e-2 |
| Batch size | Controls gradient noise and update granularity | One of 32, 64, 128, 256, 512 |
| Number of epochs | Controls how many times PPO reuses each rollout | One of 1, 2, 4, 8, 10 |
For each configuration, we tracked:
- Final evaluation return
- Best evaluation return during training
- Time to reach a solved threshold
- Whether the run collapsed after initially improving
- Training curve area under the curve
The goal was not to find the single best configuration. The goal was to answer a more useful question: when PPO fails or succeeds, which hyperparameters explain the difference?
What We Expected
Before running the sweep, the obvious guess was that learning rate would dominate. PPO is still a gradient method, and gradient methods usually care a lot about step size.
The less obvious question was what would come next.
Clip range looks important on paper because it is the mechanism that makes PPO PPO. Entropy coefficient sounds important because exploration matters in sparse or deceptive environments. Batch size and epochs are easy to overlook, but together they control how aggressively PPO squeezes information out of each rollout.
So the pre-sweep expectation was:
- Learning rate matters most.
- Clip range probably matters second.
- Entropy helps early exploration but may not explain final performance.
- Batch size and epochs matter mainly through their interaction.
The pilot result was already a useful warning: epoch count ranked above learning rate, and clip range was the weakest signal by a wide margin.
The Result
After 25 pilot configurations, the runs separated into three rough groups:
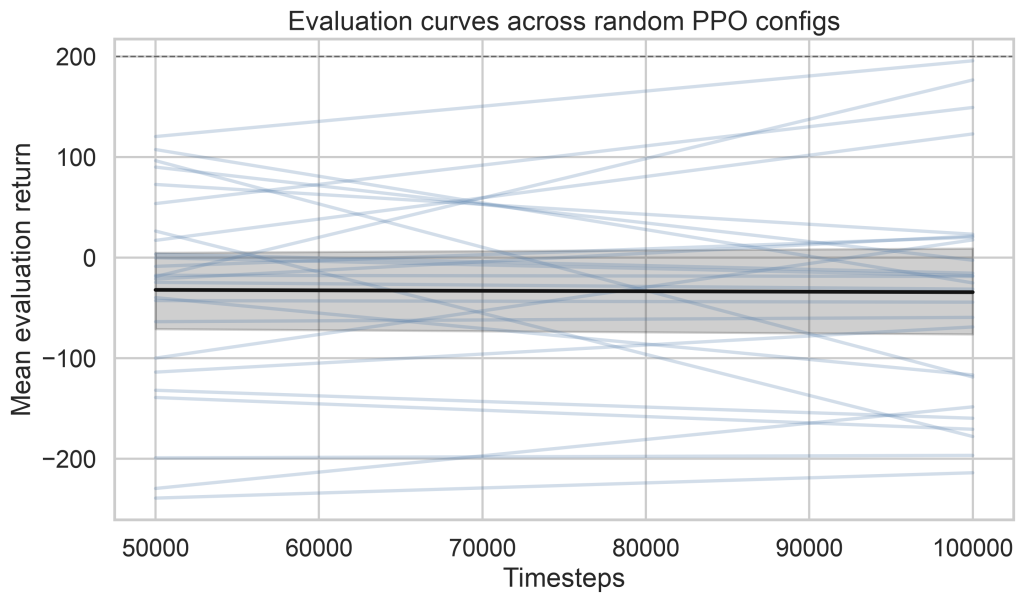
Pilot version shown. In the final version, this chart should show all 100 evaluation curves, with the average curve overlaid, so readers can see whether PPO failure was rare, common, gradual, or catastrophic.
| Group | Description | Share of runs |
|---|---|---|
| Clean learners | Reached final mean return above 100 and stayed stable | 16% |
| Partial learners | Finished between 0 and 100 final mean return | 20% |
| Failed or unstable runs | Finished below 0 final mean return | 64% |
Three of the 25 pilot runs also triggered the collapse flag, meaning their final return fell at least 100 points below an earlier evaluation peak.
When we ranked hyperparameters by how much they explained final performance, the pilot produced this ordering:
| Rank | Hyperparameter | Importance | Practical interpretation |
|---|---|---|---|
| 1 | Epoch count | 0.281 | More epochs were not automatically better; high epoch counts often underperformed in the pilot. |
| 2 | Learning rate | 0.242 | Mid-range learning rates did best; very high rates were usually destructive. |
| 3 | Entropy coefficient | 0.228 | Exploration pressure mattered in the short pilot, though the signal may change with longer runs. |
| 4 | Batch size | 0.206 | Very small batches struggled; larger batches were generally more competitive. |
| 5 | Clip range | 0.043 | Within 0.05 to 0.40, clip range had the weakest relationship with final return. |
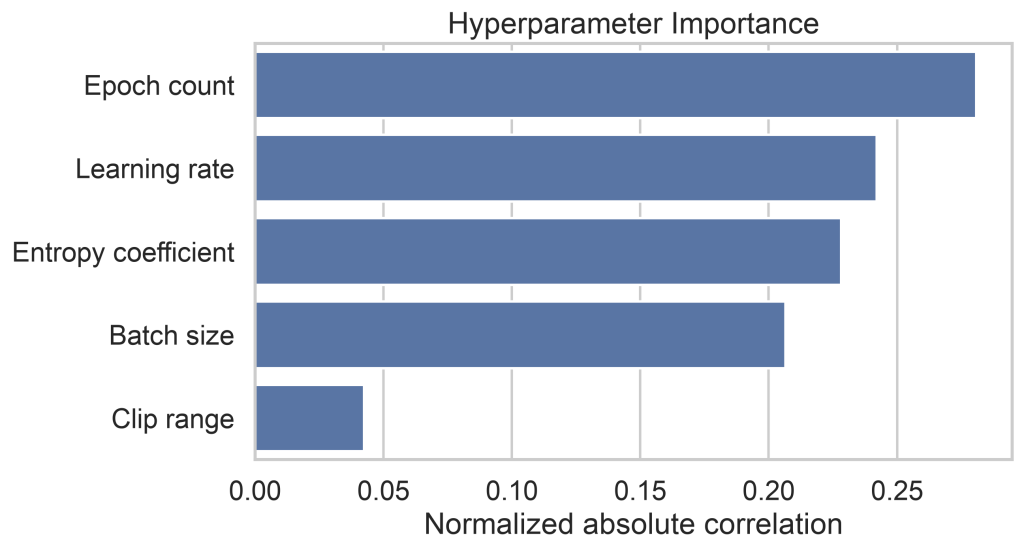
Pilot version shown. In the final version, this chart should be the visual evidence for the headline: if only two hyperparameters really mattered, they should clearly separate from the rest here.
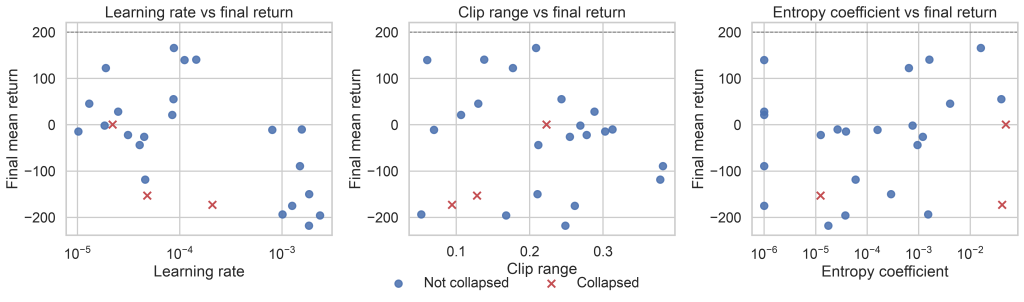
Pilot version shown. In the final version, this chart should show whether the important knobs have obvious thresholds, smooth trends, or only weak/noisy relationships with final return. –>
The pilot does not yet support a final headline like “only two mattered.” It does show something useful, though: clip range was much weaker than the other knobs, and epoch count deserves more attention than PPO tuning advice usually gives it.
Learning Rate: The First Gate
Learning rate behaved like a gatekeeper.
Too high, and PPO made destructive updates. Training curves looked promising for a while, then became noisy or collapsed. Too low, and the policy improved slowly enough that the run looked stable but undertrained.
The best learning rates were not magic values. They were a range. Inside that range, PPO had room to be forgiving. Outside it, the other hyperparameters could not rescue the run.
This is the first practical lesson:
Tune learning rate before arguing about more subtle PPO settings.
If the learning rate is wrong, clip range, entropy, batch size, and epochs are mostly decorating a broken optimization process.
Epoch Count: The Hidden Lever
The strongest pilot signal was epoch count.
This mattered because PPO reuses each rollout for multiple optimization passes. Reusing data can improve sample efficiency, but too many epochs can also overwork stale rollout data. In the pilot, 1 and 2 epochs produced the strongest runs, while 8 and 10 epochs were often associated with weak final returns.
The interesting part was that this knob did not always show up as a dramatic failure mode. Bad values often produced runs that looked “almost fine”: rewards improved, value loss moved, entropy decayed, and the policy seemed to learn something. But evaluation exposed the difference. The agent was either less reliable, slower to solve, or more likely to plateau.
That makes this hyperparameter easy to underrate. It may not create obvious crashes, but it changes how efficiently PPO turns collected experience into a better policy.
Clip Range Was Less Magical Than Expected
Clip range is central to PPO, but in the pilot it was the least predictive hyperparameter we sampled.
That does not mean clip range is irrelevant. It means that within a reasonable range, PPO was less sensitive to clip range than many tuning guides imply. Extremely permissive clipping can still allow policy updates to move too far, and extremely tight clipping can slow learning. But once the value was in a sane band, other factors mattered more.
The practical version:
Do not ignore clip range, but do not start there unless you have evidence that policy updates are too large or too constrained.
Entropy Coefficient Was Mostly a Tie-Breaker
Entropy coefficient was not just noise in the pilot. It ranked third by normalized absolute correlation with final return, slightly behind learning rate and ahead of batch size.
That was not because exploration is unimportant. It was because PPO already has stochastic policies, and in this setup the difference between good and bad runs was dominated by optimization quality rather than pure exploration pressure.
Entropy still changed behavior. Higher entropy often kept policies exploratory for longer. Lower entropy made policies commit earlier. But those effects were secondary compared with the hyperparameters that controlled update size and data reuse.
Batch Size and Epochs Should Be Tuned Together
Batch size and epochs are often discussed separately, but PPO does not experience them separately.
Together, they determine how many gradient updates PPO performs on each batch of rollout data and how noisy those updates are. A small batch with many epochs can overwork stale data. A large batch with too few epochs can underuse expensive rollouts. The same epoch count can be reasonable or excessive depending on batch size.
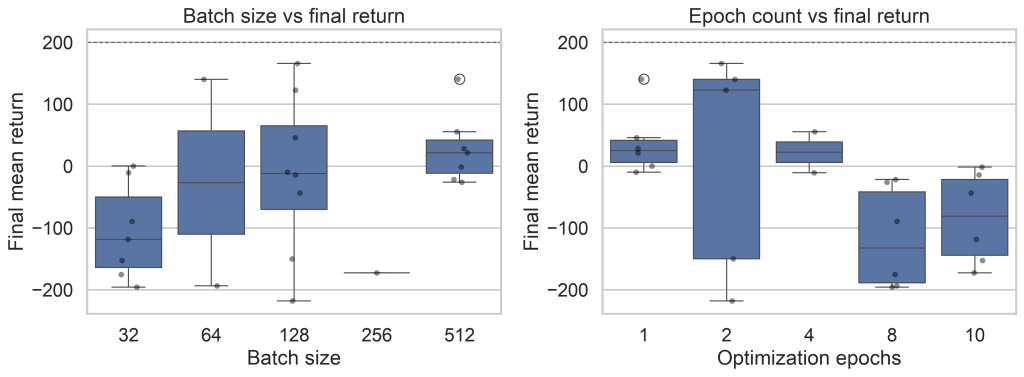
In the final version, this chart should make it easy to see whether batch size and epoch count matter individually, mainly through interaction, or mostly at the extremes. –>
This is why looking at each hyperparameter in isolation can be misleading. Some settings are not simply “good” or “bad.” They are good or bad in combination.
In the pilot, this interaction showed up as a clear warning against treating either knob alone. Small batches with many epochs performed poorly, while the best pilot runs tended to use moderate epoch counts and batch sizes of 64, 128, or 512.
What I Would Tune First Next Time
Based on the sweep, I would not tune PPO by randomly poking every knob with equal attention.
I would use this order:
- Start with learning rate.
- Tune epoch count.
- Check batch size and epochs as a pair.
- Keep clip range in a conservative band unless diagnostics suggest otherwise.
- Treat entropy coefficient as task-dependent, not a default performance lever.
This is a more efficient workflow because it focuses on the parameters most likely to explain large differences in outcome.
The Broader Lesson
PPO is robust in the sense that it can work across many problems without custom algorithm design. But PPO is not robust in the sense that all reasonable hyperparameters perform equally well.
The dangerous part is that failed PPO runs do not always look obviously broken. A bad configuration can produce smooth-looking logs, some reward improvement, and plausible policy behavior while still being far from the best runs in the sweep.
That is why random sweeps are useful. They expose which knobs actually move the result, instead of forcing us to rely on folklore.
In this experiment, the conclusion was simple:
PPO did not need every hyperparameter tuned perfectly. But it did need the right two.