June 7, 2026
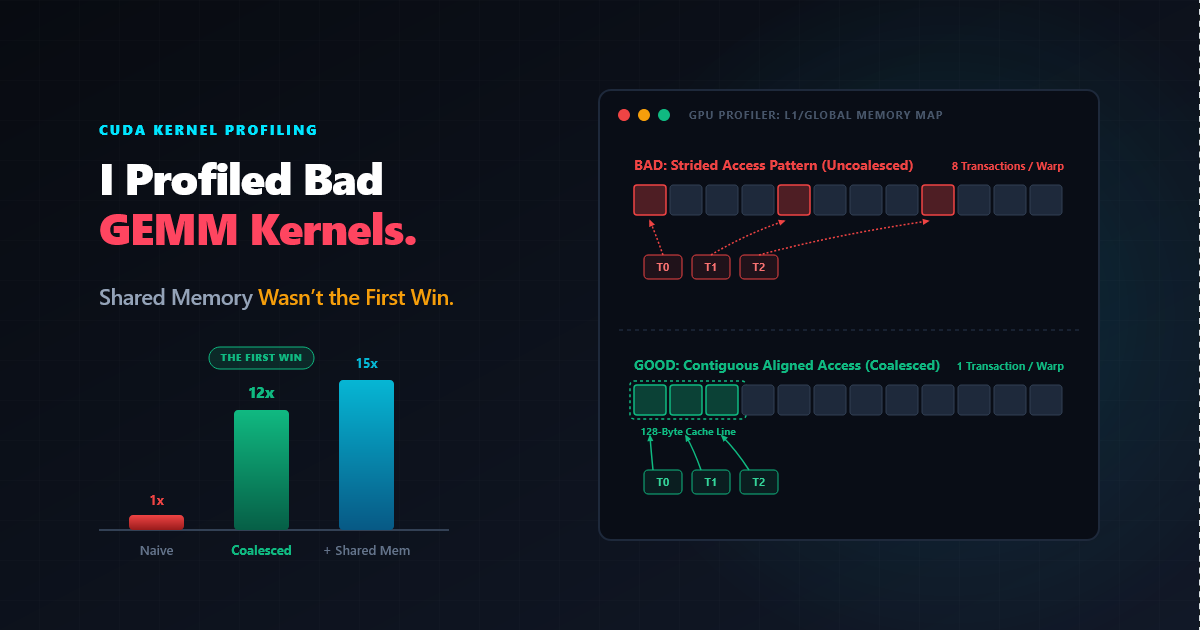
I Profiled Bad GEMM Kernels. Shared Memory Wasn’t the First Win.
I broke CUDA matrix multiplication on purpose, fixed one bottleneck at a time, and measured which optimizations actually moved performance.
CUDA optimization advice is everywhere: use shared memory, improve occupancy, coalesce memory, unroll loops, reduce synchronization, avoid bank conflicts. All of that advice can be true, but it is not equally important at every stage.
I expected the story to be simple: coalesce memory, add shared-memory tiling, tune occupancy, maybe unroll the inner loop. The profiler told a messier story. Coalescing gave a 4.09x speedup. Plain tiling actually slowed the kernel down. Then one unroll directive made the tiled version the fastest custom kernel in the test.
So I tried the experiment the blunt way: I wrote several intentionally bad GEMM kernels, profiled them, and fixed one issue at a time. The goal was not to beat cuBLAS. The goal was to answer a narrower question:
When a CUDA GEMM kernel is bad, which fixes actually move it first?
The short version: memory movement dominated, but not in the neat order I expected. Coalescing was the first huge win. Naive shared-memory tiling did not automatically help. The tiled kernel only became the fastest version after the loop body was unrolled.
Test Setup
The benchmark multiplies two dense matrices:
C = A * B
A: M x K
B: K x N
C: M x N
I used one fixed setup so the comparisons stayed honest:
| Setting | Value |
|---|---|
| GPU | NVIDIA GeForce RTX 5060, 8 GB |
| CUDA toolkit | 13.2 |
| Driver version | 591.86 |
| Matrix size | M=N=K=2048 |
| Data type | FP32 |
| Compiler flags | nvcc -O3 -lineinfo -std=c++17 -arch=sm_120 |
| Timing method | CUDA events |
| Warmup runs | 5 |
| Measured runs | 20 |
| Profiler | Nsight Compute 2026.1.1 CLI and Fournex 0.2.7 |
For each kernel, compute throughput as:
GFLOP/s = 2 * M * N * K / elapsed_seconds / 1e9
That number is not the whole story, but it is a useful sanity check.
Correctness and Timing Methodology
Every kernel was checked against a CPU reference implementation on a smaller 128x128x128 problem before timing the 2048x2048x2048 benchmark. The reported max_abs_error was 0.0000 for every variant in the benchmark CSV.
The timing number is the average CUDA-event time across 20 measured launches after 5 warmup launches. I did not compute standard deviation in this version of the harness, so I treat small differences cautiously. A 4.09x change is real. A 1.01x block-shape difference is a hint, not a law.
Baseline: A Terrible GEMM Kernel
The baseline kernel is deliberately simple and deliberately bad. Each thread computes one output element. For every output element, it walks across K and reads from A and B directly from global memory.
__global__ void gemm_bad(
    const float* A,
    const float* B,
    float* C,
    int M,
    int N,
    int K) {
  int row = blockIdx.x * blockDim.x + threadIdx.x;
  int col = blockIdx.y * blockDim.y + threadIdx.y;

  if (row >= M || col >= N) {
    return;
  }

  float acc = 0.0f;

  for (int k = 0; k < K; ++k) {
    acc += A[row * K + k] * B[k * N + col];
  }

  C[row * N + col] = acc;
}
This is the kernel many people write first when learning CUDA GEMM. It is readable, but it asks global memory to do too much work.
Every thread rereads values that nearby threads also need. The kernel has no tiling, no shared-memory reuse, and no attempt to improve arithmetic intensity. Depending on the block layout, some accesses are also poorly coalesced. The GPU is capable of doing far more floating-point work than this kernel can feed.
Baseline results:
| Version | Time | GFLOP/s | Nsight Signal | Main Bottleneck |
|---|---|---|---|---|
| Bad GEMM | 55.8695 ms | 307.5001 | 98.06% Speed of Light memory throughput, 99.05% L1/TEX throughput | Bad memory access pattern |
The important thing is not that the kernel is slow. The useful part is what the profiler says is causing the slowdown. If the profiler points at memory access efficiency and low reuse, then starting with unrolling would be optimizing the wrong thing.
Fix 1: Coalesce The Obvious Memory Accesses
The first fix was to make the memory access pattern sane. In CUDA, neighboring threads in a warp should usually access neighboring memory addresses. When they do, the hardware can combine those requests into efficient memory transactions.
The bad version makes it easy to accidentally assign rows and columns in a way that gives each warp scattered addresses:
int row = blockIdx.x * blockDim.x + threadIdx.x;
int col = blockIdx.y * blockDim.y + threadIdx.y;
C[row * N + col] = acc;
The corrected version maps threadIdx.x to the contiguous column dimension of row-major C and B:
int row = blockIdx.y * blockDim.y + threadIdx.y;
int col = blockIdx.x * blockDim.x + threadIdx.x;
C[row * N + col] = acc;
This change does not make the algorithm clever. It still computes one output element per thread and still rereads global memory repeatedly. But it removes a basic tax from the memory system.
Coalescing results:
| Change | Time | GFLOP/s | Speedup |
|---|---|---|---|
| Baseline bad mapping | 55.8695 ms | 307.5001 | 1.00x |
| Coalesced loads/stores | 13.6520 ms | 1258.4174 | 4.09x |
This was the first major lesson: before thinking about fancy optimizations, the kernel needed sane memory access. The profiler did not ask for cleverness. It asked for fewer wasted memory transactions.
Fix 2: Add Shared Memory Tiling
Coalescing made memory access less wasteful, but it did not solve the deeper problem. The kernel still fetched the same A and B values from global memory repeatedly.
Shared memory tiling changes that. A block cooperatively loads a tile of A and a tile of B, then threads reuse those tiles while accumulating a tile of C.
The shape is:
template
__global__ void gemm_tiled(
    const float* A,
    const float* B,
    float* C,
    int M,
    int N,
    int K) {
  __shared__ float As[TILE][TILE];
  __shared__ float Bs[TILE][TILE];

  int row = blockIdx.y * TILE + threadIdx.y;
  int col = blockIdx.x * TILE + threadIdx.x;

  float acc = 0.0f;

  for (int tile = 0; tile < K; tile += TILE) {
    int a_col = tile + threadIdx.x;
    int b_row = tile + threadIdx.y;

    As[threadIdx.y][threadIdx.x] =
        (row < M && a_col < K) ? A[row * K + a_col] : 0.0f;
    Bs[threadIdx.y][threadIdx.x] =
        (b_row < K && col < N) ? B[b_row * N + col] : 0.0f;

    __syncthreads();

    for (int k = 0; k < TILE; ++k) {
      acc += As[threadIdx.y][k] * Bs[k][threadIdx.x];
    }

    __syncthreads();
  }

  if (row < M && col < N) {
    C[row * N + col] = acc;
  }
}
This is not a production GEMM. It is still a teaching kernel. But it introduces the idea that should matter: data reuse.
Shared memory matters here because each global load can contribute to multiple multiply-adds. That increases arithmetic intensity, which is exactly what the baseline lacked.
Tiling results:
| Version | Time | GFLOP/s | Speedup vs previous | Profiler Signal |
|---|---|---|---|---|
| Coalesced GEMM | 13.6520 ms | 1258.4174 | 1.00x | 95.42% compute/memory throughput |
| Tiled 16×16 GEMM | 15.0255 ms | 1143.3793 | 0.91x | 97.30% compute/memory throughput |
This was the first result that contradicted my expectation. The tiled kernel did more theoretically sensible work, but this particular 16×16 teaching implementation was slower than the coalesced naive kernel.
The lesson is not “always tile.” Tiling changes the performance problem, and you still have to profile the version you actually wrote.
Why Tiling Lost Here
The tiled kernel improved data reuse, but it also introduced shared-memory instructions, barriers, and a small inner loop. In this implementation, the reuse benefit was not enough until the inner loop was unrolled.
The evidence points in that direction:
| Check | Result | Interpretation |
|---|---|---|
| Coalesced naive -> tiled 16×16 | 0.91x | Reuse did not offset overhead yet |
| Extra-sync tiled -> cleaned tiled | 1.06x | Barriers mattered, but were not the whole problem |
| Tiled 16×16 -> tiled 16×16 + unroll | 1.48x | The tiled inner loop was a real cost |
This does not mean shared memory is bad. It means “uses shared memory” is not a performance argument by itself. The implementation has to make the reuse cheap enough to matter.
Fix 3: Remove Unnecessary Synchronization
After tiling, synchronization becomes necessary. A block must wait until the A and B tiles are loaded, and it must wait before overwriting shared memory for the next tile.
But it is easy to add more barriers than needed:
__syncthreads();

for (int k = 0; k < TILE; ++k) {
  acc += As[threadIdx.y][k] * Bs[k][threadIdx.x];
  __syncthreads();  // unnecessary
}

__syncthreads();
The cleaned-up version keeps the barriers at the tile boundary:
__syncthreads();

for (int k = 0; k < TILE; ++k) {
  acc += As[threadIdx.y][k] * Bs[k][threadIdx.x];
}

__syncthreads();
This helped, but it was not the same kind of improvement as coalescing or tiling. Removing unnecessary barriers is good engineering. It just was not the dominant problem while global memory behavior was still poor.
Synchronization cleanup results:
| Version | Time | GFLOP/s | Speedup vs previous |
|---|---|---|---|
| Tiled with extra syncs | 15.8779 ms | 1082.0004 | 1.00x |
| Tiled with minimal syncs | 15.0255 ms | 1143.3793 | 1.06x |
The cleanup helped by about 6%. That is worth taking, but it did not change the shape of the result. The tiled kernel was still slower than the coalesced naive kernel.
Fix 4: Tune Block Shape And Occupancy
Occupancy is one of the most misunderstood CUDA metrics. High occupancy means the GPU can keep more warps resident, which can help hide latency. But higher occupancy does not automatically mean higher performance.
For this experiment, the block shapes should be compared with the same algorithm:
| Block Shape | Occupancy | Time | GFLOP/s | Result |
|---|---|---|---|---|
| 8×8 | not profiled | 17.8376 ms | 963.1267 | Too small |
| 16×16 | 99.62% achieved | 15.0255 ms | 1143.3793 | Good baseline |
| 32×8 | not profiled | 15.4894 ms | 1109.1357 | Similar, slightly slower |
| 32×16 | not profiled | 14.8051 ms | 1160.4037 | Best non-unrolled tiled shape |
The expected lesson is not “16×16 is always best” or “maximize occupancy.” The lesson is to treat occupancy as a diagnostic metric, not a scoreboard.
The block-shape sweep was not dramatic. The best non-unrolled tiled version was 32×16 at 14.8051 ms, only about 1.01x faster than the 16×16 tiled version. I only captured full Nsight occupancy for the 16×16 version, so I would not over-interpret this sweep. The useful result is narrower: changing block shape moved performance slightly, but did not explain the major jumps.
Fix 5: Try Loop Unrolling
Only after the larger memory problems were fixed did I try a micro-optimization:
#pragma unroll
for (int k = 0; k < TILE; ++k) {
  acc += As[threadIdx.y][k] * Bs[k][threadIdx.x];
}
Unrolling can reduce loop overhead and expose more instruction-level parallelism. It can also increase register pressure or code size. Like occupancy, it is not automatically good.
Unrolling results:
| Version | Time | GFLOP/s | Speedup vs previous | Notes |
|---|---|---|---|---|
| Tiled 16×16 | 15.0255 ms | 1143.3793 | 1.00x | Loop not unrolled |
| Tiled 16×16 + unroll | 10.1478 ms | 1692.9620 | 1.48x | Fastest measured custom kernel |
This is where order matters. If I had started with #pragma unroll, I would have been optimizing a bad memory layout. After coalescing and tiling, unrolling attacked a much more relevant part of the remaining cost: the tight inner loop over the tile.
Tile-Size Sweep
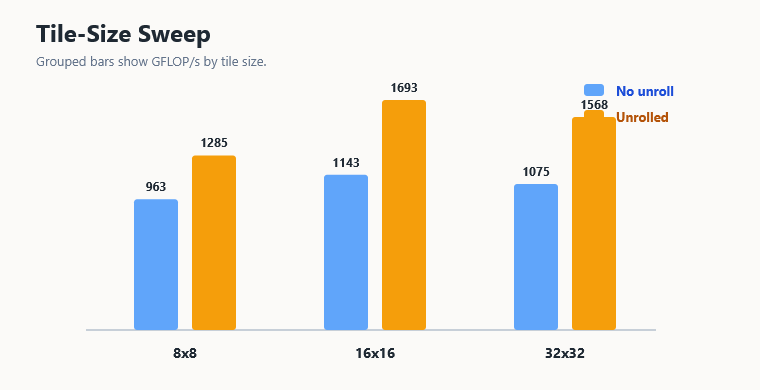
To check whether the 16×16 tiled result was just a bad tile size, I also ran a square tile sweep. This does not prove a universal best tile size, but it answers the narrower question: did naive tiling lose only because I picked 16?
| Kernel | Tile | Unrolled? | Time | GFLOP/s |
|---|---|---|---|---|
| Tiled | 8×8 | No | 17.8376 ms | 963.1267 |
| Tiled | 16×16 | No | 15.0255 ms | 1143.3793 |
| Tiled | 32×32 | No | 15.9742 ms | 1075.4740 |
| Tiled | 8×8 | Yes | 13.3690 ms | 1285.0558 |
| Tiled | 16×16 | Yes | 10.1478 ms | 1692.9620 |
| Tiled | 32×32 | Yes | 10.9537 ms | 1568.4144 |
The sweep makes the result more convincing. Plain square tiling lost at every tile size I tested against the coalesced naive kernel. Unrolling helped every tiled size, and 16×16 unrolled was the best custom kernel in this harness.
cuBLAS Reference
The goal was not to beat cuBLAS. cuBLAS is included only as a ceiling and sanity check.
| Kernel | GFLOP/s | % of cuBLAS |
|---|---|---|
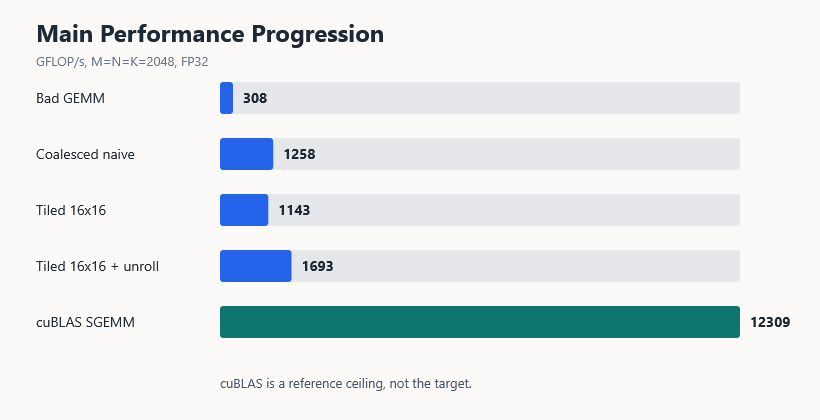
| Bad GEMM | 307.5001 | 2.5% |
| Coalesced naive | 1258.4174 | 10.2% |
| Tiled 16×16 + unroll | 1692.9620 | 13.8% |
| cuBLAS SGEMM | 12308.9654 | 100.0% |
That gap is healthy to show. The final custom kernel is much better than the broken baseline, but it is not “good GEMM” in the production-library sense.
What Actually Mattered
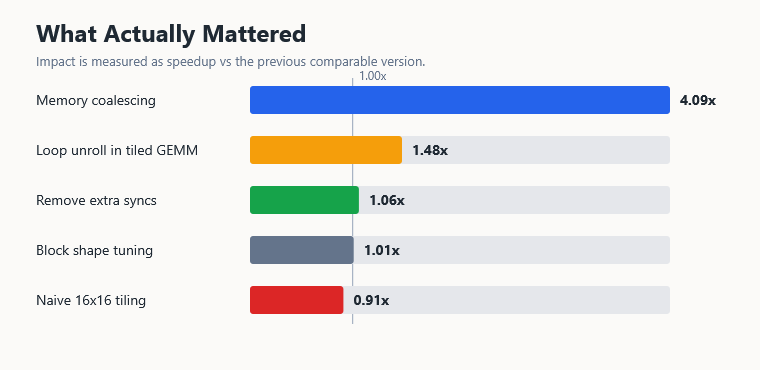
Here is what actually moved performance in this harness:
| Rank | Optimization | Impact | Why It Mattered |
|---|---|---|---|
| 1 | Memory coalescing | 4.09x | Fixed the most obvious memory-layout mistake |
| 2 | Loop unrolling inside tiled GEMM | 1.48x | Made the tiled inner loop cheap enough to win |
| 3 | Removing extra syncs | 1.06x | Reduced unnecessary barrier overhead |
| 4 | Block shape tuning | 1.01x | Helped slightly, but did not transform the kernel |
| 5 | Naive 16×16 tiling, not unrolled | 0.91x | Reuse did not offset shared-memory, barrier, and loop overhead yet |
This is not a universal CUDA hierarchy. It is the ranking for this code, on this GPU, with this matrix size.
For this set of bad GEMM kernels, the strongest lesson was that correct-sounding optimizations can still lose in their first implementation. Coalescing made the kernel 4.09x faster. Plain tiling made it slower. Unrolling then made the tiled version the fastest custom kernel, reaching 1692.9620 GFLOP/s.
Where My Analyzer Failed
I also ran these kernels through Fournex 0.2.7 to see whether the analyzer identified the same bottlenecks I saw manually.
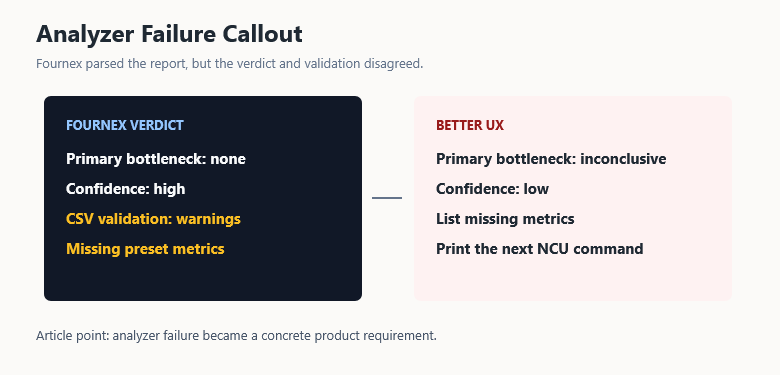
This was the most useful failure in the experiment. Nsight Compute showed that the optimization path was driven by memory behavior and inner-loop structure. Fournex did not catch that. It parsed each targeted Nsight report and reported one kernel with high measured confidence, but the exported CSV also triggered validation warnings about missing preset metrics. Its primary bottleneck label was none for the targeted kernels, so I would not use that label as the article’s diagnosis.
One detail matters here: Nsight’s Speed of Light “memory throughput” signal is not the same number as the DRAM-throughput percentage Fournex printed from the limited CSV. The former was the useful bottleneck signal in this run; the latter was only one extracted metric from an incomplete export.
Kernel: bad_uncoalesced
Primary bottleneck: none
Confidence: high (measured_ncu)
Measured DRAM throughput: 5.7%
CSV validation: warnings about incomplete preset metrics
Compared with the actual optimization sequence:
| Kernel | Manual Diagnosis | Fournex Diagnosis | Matched? |
|---|---|---|---|
| Bad GEMM | Bad memory access pattern; Nsight memory throughput saturated | none, high confidence, validation warnings | No |
| Coalesced GEMM | Major speedup from fixing memory layout | none, high confidence, validation warnings | No |
| Tiled GEMM | Tiling overhead outweighed reuse in this implementation | none, high confidence, validation warnings | No |
| Tiled + unroll | Inner-loop unrolling made tiled version fastest | none, high confidence, validation warnings | No |
That is still useful to write down. In this run, Nsight Compute carried the diagnosis, while Fournex mainly showed that analyzer output depends heavily on the exact metrics and export format you feed it.
The product fix is obvious: degraded-input mode. If the CSV is missing key memory, coalescing, occupancy, or scheduler metrics, the analyzer should not return high-confidence none. It should return inconclusive, lower confidence, list the missing evidence, and print the exact Nsight Compute command needed to collect it.
Final Lesson
The biggest mistake in CUDA optimization is optimizing what is easy to change instead of what the profiler says matters.
In this experiment, the easy changes were tempting. Add an unroll pragma. Change a block size. Delete a synchronization point. Those are quick edits, and quick edits feel productive.
But the measurements pushed back on the tidy version of the story. Coalescing was obviously important. Tiling was not automatically important. Removing barriers helped a little. Block shape tuning helped a little. Unrolling helped a lot, but only after the kernel had a tiled inner loop where unrolling mattered.
That is the practical lesson I would take into the next CUDA kernel:
Profile first. Fix the bottleneck the profiler actually shows. Measure one change at a time. Do not confuse a familiar optimization with the optimization your kernel needs.
For these bad GEMM kernels, the first priority was still memory layout. But the final ranking was less generic and more interesting: coalescing mattered most, plain tiling disappointed, and unrolling turned the tiled version into the fastest measured kernel. The profiler did not just tell me the kernel was slow. It corrected the story I expected to tell.