March 7, 2026
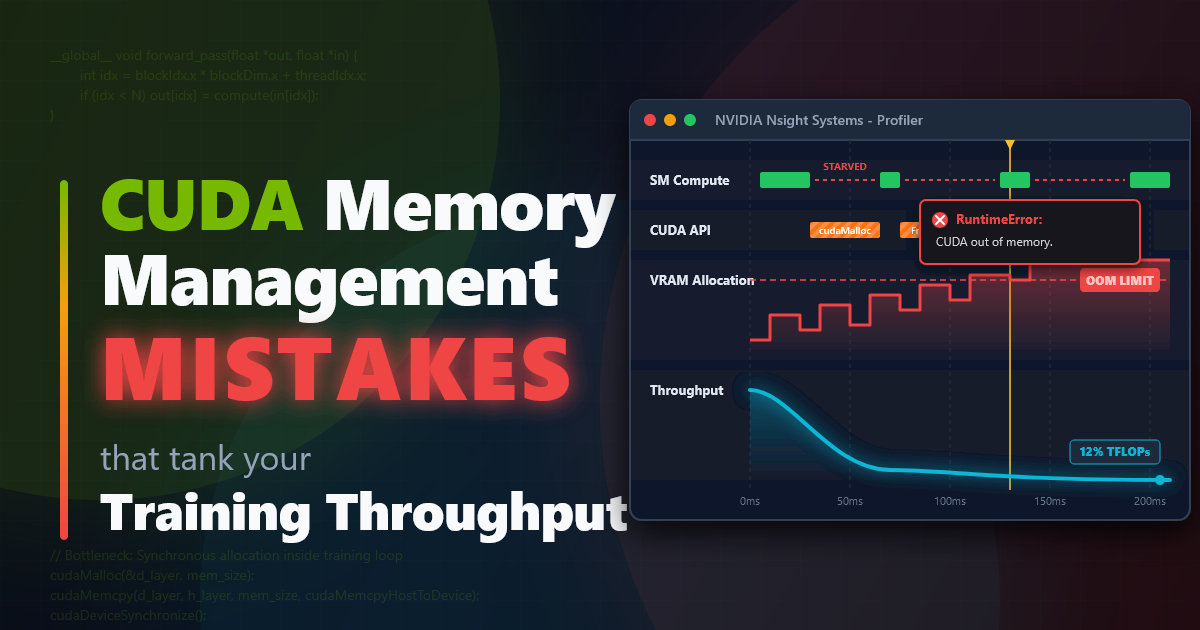
CUDA memory management mistakes that tank your training throughput
CUDA Memory Management Mistakes That Quietly Kill Training Throughput
Most CUDA performance advice is presented as if every mistake cuts throughput in half.
That is not what real profiling looks like.
I benchmarked three common GPU-side mistakes on an RTX 5060 using PyTorch and Nsight Systems:
- synchronizing the device inside the training loop
- copying batches from pageable host memory instead of pinned memory
- recreating buffers instead of reusing them
Only one of these produced a large win in this setup. The others ranged from modest to barely measurable. That is exactly why the profiler matters: it tells you which mistakes are actively hurting throughput on your machine, and which ones are simply adding structural overhead that may become expensive later.
The headline result was clear. The biggest avoidable loss was unnecessary synchronization in the hot path.
| Experiment | Bad | Good | Speedup |
|---|---|---|---|
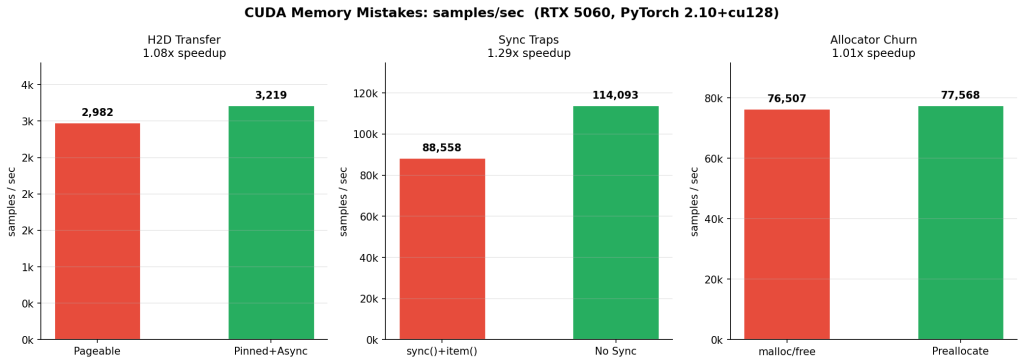
| Sync traps (C) | 88,558 samples/s | 114,093 samples/s | 1.29x |
| H2D transfer (B) | 2,982 samples/s | 3,219 samples/s | 1.08x |
| Allocator churn (A) | 76,507 samples/s | 77,568 samples/s | 1.01x |
The table gives the ranking. The Nsight timelines explain the why.
How I Measured It
These numbers came from a local synthetic training benchmark with fixed inputs, warmup iterations, and repeated steady-state measurement. For each variant I recorded:
- mean step time
- p50 and p95 latency
- throughput in samples per second
- PyTorch-reported allocated and reserved memory
- an Nsight Systems timeline capture
1. Synchronization Traps: The Fastest Way To Lose Free Throughput
This was the cleanest result in the entire set.
In the bad version, the training loop synchronizes the device every step. In the good version, synchronization is deferred to the measurement boundary instead of being forced into the hot path.
The difference was immediate:
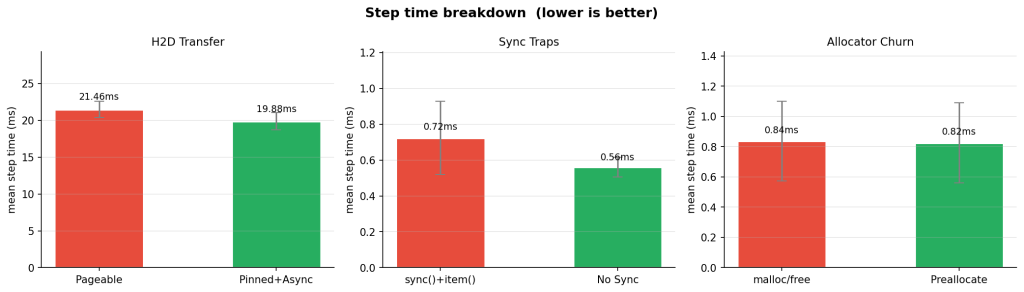
- Bad: 0.723 ms mean step time, 88,558 samples/s
- Good: 0.561 ms mean step time, 114,093 samples/s
- Net result: 29% higher throughput
This is one of the most common CUDA performance mistakes because it often hides behind code that looks harmless:
torch.cuda.synchronize()inside the training loop- reading
.item()from a CUDA tensor every iteration - printing or logging CUDA values mid-step
- timing GPU work with the wrong synchronization pattern
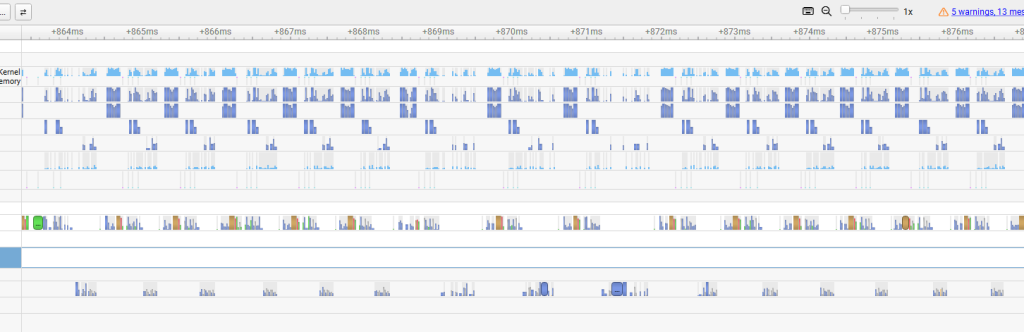
The GPU wants a queue of work. Explicit synchronization turns that queue into a stop-and-report cycle. In Nsight Systems, the result is obvious: barriers appear, overlap disappears, and the GPU spends more time waiting for the CPU to ask for the next thing.
If I had to pick one section for readers to remember, it would be this one. The biggest throughput killer in this benchmark was not memory bandwidth or kernel math. It was unnecessary waiting.
2. Pageable vs Pinned Host Memory: Not Dramatic Here, Still Worth Doing
The second experiment measured the input path: pageable host memory versus pinned host memory with a non-blocking copy path.
The measured gain was smaller:
- Bad: 21.463 ms mean step time, 2,982 samples/s
- Good: 19.882 ms mean step time, 3,219 samples/s
- Net result: 8% higher throughput
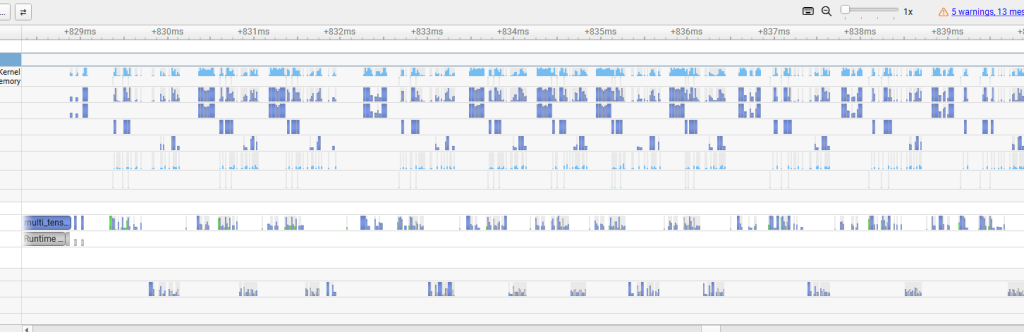
Suggested caption: “Pinned host buffers reduce copy overhead and make the transfer path fit more cleanly beside compute.”
An 8% win is not a flashy benchmark result, but it is still a real one. On a modern desktop with a fast GPU and a fast interconnect, the pageable baseline is already fairly strong. That compresses the visible improvement.
Pinned memory matters more when:
- batches are larger
- the job is copy-bound instead of compute-bound
- the host platform is slower
- the system is on PCIe 4.0 or worse
- non-blocking transfers need to overlap cleanly with compute
So the right lesson here is not “pinned memory always produces a huge gain.” The lesson is that pinned memory removes avoidable friction from the input path, and the payoff scales with how transfer-bound the workload actually is.
That is also why this optimization is still worth recommending broadly. It is a low-complexity fix with a clear systems rationale, and the profiler confirms that the transfer path gets cleaner even when the end-to-end speedup is modest.
3. Allocation Churn: A Real Smell, But PyTorch Hides Most Of The Immediate Cost
The third experiment was the most humbling one.
I expected repeated allocation in the loop to hurt more than it did. Instead, the throughput difference was nearly flat:
- Bad: 0.837 ms mean step time, 76,507 samples/s
- Good: 0.825 ms mean step time, 77,568 samples/s
- Net result: about 1% higher throughput
Suggested caption: “Reusing buffers reduces allocator activity in the CUDA API lane, but PyTorch’s caching allocator masks most of the immediate throughput penalty in this microbenchmark.”
This does not mean allocation churn is harmless. It means PyTorch’s caching allocator is good enough to absorb a lot of the damage in a short, stable benchmark.
That is useful information. It changes the story from a lazy “never allocate in the loop or everything falls apart” into a more accurate one:
- repeated allocation still shows up as unnecessary work in the profiler
- buffer reuse and stable shapes are still better practice
- the larger risks tend to appear over longer runs, under shape churn, or near memory limits
- fragmentation and headroom loss are often more important than immediate step-time collapse
- forced allocator disruption, including bad
empty_cache()usage patterns, can make this much worse
This section belongs in the article precisely because the result is not dramatic. Readers should see that good profiling is not about forcing every benchmark into a heroic 2x win. It is about distinguishing between “this is killing me now” and “this is technical debt the framework is partially masking.”
Why The Profiler Matters More Than The Table
Benchmark tables settle arguments about magnitude. Profilers settle arguments about mechanism.
That distinction matters in CUDA work because many regressions are structural before they are catastrophic:
- white space in the timeline means idle hardware
- sync barriers reveal forced serialization
- transfer lanes show whether data motion is the actual bottleneck
- CUDA API activity exposes work that should not be inside the steady-state step
Without the Nsight timeline, experiment A would look almost pointless. With the timeline, it becomes a useful lesson in allocator behavior and framework masking. Without the timeline, experiment B would look like a small win. With the timeline, it becomes evidence that the input path really did get cleaner. And experiment C needs almost no interpretation at all once you see the barriers.
That is the bigger lesson from the entire exercise: CUDA performance mistakes are often easier to believe when you can see the machine stop doing useful work.
Practical Takeaways
If you only want the operational checklist, it is short:
- keep explicit synchronization out of the training loop unless it is functionally required
- avoid hot-path
.item()calls and other hidden sync triggers - use pinned host memory for batches copied to the GPU every step
- use non-blocking transfers where the surrounding pipeline can benefit
- reuse buffers and keep tensor shapes stable when possible
- profile the actual workload before turning style advice into dogma
Conclusion
The strongest throughput improvement in this benchmark came from removing synchronization, not from a memory copy trick and not from allocator cleanup. That is a useful reminder.
The slowdowns that matter most are not always the ones people talk about most loudly. Some mistakes cost you immediately. Others are softened by the framework, the hardware, or the size of the benchmark. The only reliable way to tell the difference is to profile.
That is what makes Nsight Systems so valuable for this kind of post. It does not just tell you that throughput changed. It shows you where the GPU stopped being fed, where the CPU started waiting, and where extra work crept into the steady-state loop.
If you are trying to make CUDA training code faster, start with the timeline. The speedups come after that.